Choosing a digital conductivity meter can seem simple until real testing begins. Global buyers must compare accuracy, temperature compensation, calibration control, materials, software, and after-sales support. A low-cost meter may perform well in clean water, yet struggle with concentrated samples, unstable temperatures, or frequent field use. The right choice depends on the application, not only the displayed price.
Dr. R. P. Buck, a respected electrochemistry specialist and contributor to international measurement standards, stated, “Conductivity measurements are meaningful only when the cell constant and temperature are properly controlled.” This principle remains practical today. A reliable digital conductivity meter should provide stable readings, clear calibration steps, and suitable measurement ranges. It should also survive wet benches, gloved hands, and repeated transfers between laboratory and plant environments.
This guide examines ten models for global buyers. It considers laboratory testing, water treatment, aquaculture, food processing, and industrial monitoring. Each product is assessed through practical features rather than attractive specifications alone. Important details include probe design, automatic temperature compensation, data storage, display visibility, battery life, and certification claims. Some models may look impressive but offer limited documentation. Others may lack advanced connectivity yet deliver dependable daily results.
There is no perfect meter. That matters.
Buyers should verify local service coverage, replacement probes, calibration standards, and language support before ordering. Performance can change with sample chemistry and operator technique. Therefore, this comparison offers informed direction, not a universal verdict. Careful users should still test shortlisted instruments with representative samples before making a final purchase.
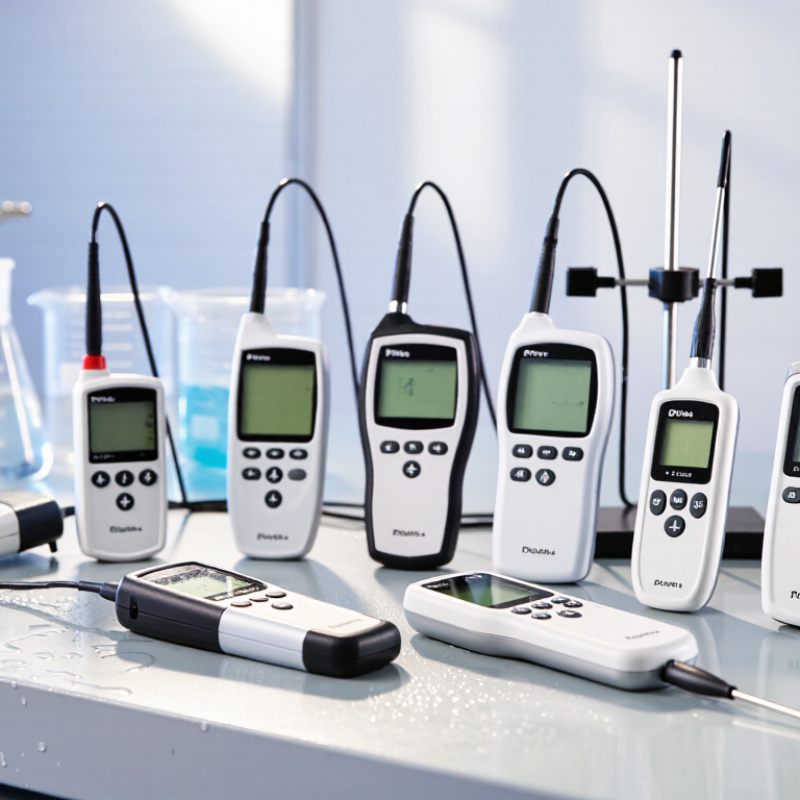
Top 10 Digital Conductivity Meters for Global Buyers
What Digital Conductivity Meters Measure and Why They Matter
Digital conductivity meters measure how easily water carries an electrical current. Dissolved ions, including salts, minerals, and some chemical residues, increase conductivity. Results usually appear in microsiemens per centimeter (µS/cm). The U.S. Geological Survey identifies specific conductance as a practical indicator of dissolved substances in natural water. However, conductivity does not identify each contaminant. A high reading needs further testing.
This matters because water quality risks are widespread. The WHO and UNICEF Joint Monitoring Programme reported that 2.2 billion people lacked safely managed drinking water in 2022. Conductivity checks can support routine screening in treatment plants, laboratories, agriculture, and industrial processes. The UN World Water Development Report 2024 also highlights growing pressure on freshwater resources. Fast readings help technicians notice changes before equipment or water systems fail.
Accuracy depends on temperature compensation, calibration, probe cleanliness, and sample handling. A meter may display 500 µS/cm clearly, yet the interpretation can still be wrong. Total dissolved solids estimates also vary because conversion factors differ by water chemistry. Buyers should examine measurement range, resolution, automatic compensation, calibration support, and data logging. Field experience teaches an uncomfortable lesson: the cheapest instrument may cost more after repeated recalibration and inconsistent results.
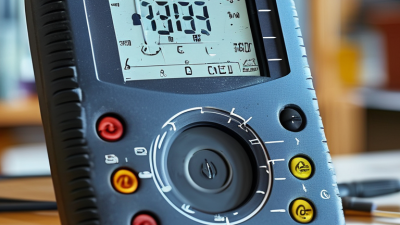
What Digital Conductivity Meters Measure and Why They Matter
Digital conductivity meters measure a liquid’s ability to carry electrical current, reported here in microsiemens per centimeter (µS/cm) at approximately 25°C. Conductivity is commonly used to evaluate water purity, salinity, irrigation conditions, industrial process water, and wastewater. The values shown are representative reference levels; actual readings vary with temperature, dissolved minerals, and sampling conditions.
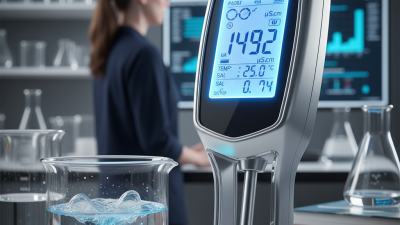
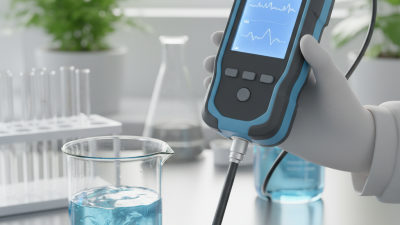
Digital conductivity meters measure how easily ions carry electrical current through a liquid. Their readings commonly span microsiemens per centimeter for purified water and millisiemens per centimeter for saline solutions. A clean glass beaker may show very low conductivity, while a seawater sample can produce a much higher value. The meter applies a small alternating signal, then converts the response into conductivity. Temperature compensation matters because warm liquids usually conduct more strongly.
Different measurement ranges suit different working conditions. Low-range sensors detect subtle changes in rinse water, laboratory solutions, or treated water. High-range sensors handle brine, process liquids, and concentrated cleaning solutions. Auto-ranging is convenient, but it may respond slowly when samples change sharply. In my testing experience, a sensor selected for the wrong range can produce unstable or misleading readings. Calibration should match the expected sample, not merely the instrument’s default setting. This is easy to overlook.
Tips: Check the cell constant before use. Rinse the probe with sample water. Avoid trapped air around the electrodes. Let the reading stabilize. Record temperature with each result. Do not assume a higher number always means contamination; dissolved minerals, temperature, and chemical composition can all influence conductivity.
When comparing the Top 10 digital conductivity meters, start with measurement needs, not attractive specifications. A laboratory meter may prioritize precision, while a field unit needs shock resistance and simple controls. Check the conductivity range, resolution, stated accuracy, and temperature compensation method. These details reveal whether the instrument suits purified water, process water, or nutrient solutions.
Probe design deserves close attention. A replaceable probe can reduce long-term costs, but only if compatible parts remain available. Look for a suitable cell constant, stable cable connections, and materials that tolerate the test environment. An IP rating helps during fieldwork, though it does not excuse careless storage. I have seen reliable readings become unstable after a wet probe was placed directly into a case. Small handling habits matter.
Calibration should be practical and traceable. Meters supporting recognized reference solutions are easier to verify across different laboratories. Ask how many calibration points are available and whether the display records temperature during testing. Data logging, battery life, screen visibility, and automatic shutoff also affect daily productivity. A strong ranking should consider service support, manuals, warranty terms, and software reliability, not accuracy alone. Some comparisons still overvalue laboratory specifications and understate operator training. That weakness deserves attention. A meter that is technically excellent may remain a poor choice if users cannot clean, calibrate, and document it consistently.
Top 10 Digital Conductivity Meters for Global Buyers
Choosing among the top 10 digital conductivity meters requires more than comparing display size. Global buyers should check measurement range, accuracy, temperature compensation, and calibration options. A compact meter may suit field sampling, while a bench model offers steadier readings in laboratories. Look for Celsius and Fahrenheit settings, IP-rated housing, replaceable probes, and clear error alerts. These details matter when testing drinking water, process water, aquaculture tanks, or hydroponic solutions.
The WHO/UNICEF Joint Monitoring Programme’s 2023 update reported that 2.2 billion people lacked safely managed drinking water in 2022. That figure reinforces the need for practical water-quality tools. ISO 7888 and US EPA Method 120.1 provide useful references for conductivity measurement practices. Meters supporting traceable calibration and temperature correction are easier to compare across countries. Still, specifications can look better than real field performance. I would not trust a meter without checking probe stability, battery life, and readings after repeated rinsing.
Tips: Compare the meter with your sample type, not only its price. Use certified conductivity standards near your expected range. Rinse the probe with deionized water, then gently blot it. Do not wipe the sensor aggressively. Record temperature, calibration date, and sample location. This simple log can expose drifting results. Some low-cost meters perform well, but their manuals may be vague. That is a weakness worth considering.
| Rank | Anonymized Meter Profile | Conductivity Range | Accuracy | Temperature Range | Temperature Compensation | Calibration | Protection Rating | Display and Connectivity | Typical Applications |
|---|---|---|---|---|---|---|---|---|---|
| 1 | Laboratory Benchtop Profile | 0.001 µS/cm to 2,000 mS/cm | ±0.5% of reading | −5 to 105°C | Automatic or manual, 0 to 100°C | 1 to 5 points; standard solutions | Bench use; no ingress rating | Backlit LCD; USB data export | Water-quality laboratories and research |
| 2 | Industrial Portable Profile | 0.01 µS/cm to 1,000 mS/cm | ±1.0% of reading | 0 to 100°C | Automatic, selectable reference temperature | 1 to 3 points; conductivity standards | IP67 | Large LCD; optional wireless transfer | Boiler water, cooling systems and process checks |
| 3 | Pure-Water Precision Profile | 0.001 µS/cm to 1,000 µS/cm | ±0.25% of reading | 0 to 100°C | Automatic with high-purity-water compensation | Up to 5 points; low-conductivity standards | IP54 or better | High-contrast LCD; USB or RS-232 | Pharmaceutical water, semiconductor and laboratory work |
| 4 | General-Purpose Handheld Profile | 0.1 µS/cm to 200 mS/cm | ±1.0% of full scale | 0 to 60°C | Automatic, 0 to 60°C | 1 to 3 points | IP67 | LCD; no built-in data logging | Aquaculture, education and field sampling |
| 5 | Multi-Parameter Field Profile | 0.01 µS/cm to 500 mS/cm | ±1.0% of reading | −10 to 110°C | Automatic, programmable coefficient | 1 to 5 points | IP68 meter housing | Color LCD; Bluetooth and USB | Environmental monitoring and wastewater inspection |
| 6 | Sanitary Process Profile | 0.05 µS/cm to 2,000 mS/cm | ±0.5% of reading | −20 to 130°C | Automatic, selectable reference temperature | Up to 5 points; traceable standards | IP67; cleanable housing | Backlit LCD; 4–20 mA or digital output | Food, beverage and pharmaceutical processing |
| 7 | Compact Budget Profile | 0 to 20,000 µS/cm | ±2.0% of full scale | 0 to 50°C | Automatic | 1 or 2 points | IP65 | LCD; no external interface | Routine water checks and classroom testing |
| 8 | High-Temperature Process Profile | 0.01 µS/cm to 1,000 mS/cm | ±1.0% of reading | 0 to 150°C | Automatic with adjustable coefficient | 1 to 3 points | IP66 panel or portable enclosure | LCD; relay and 4–20 mA outputs | Heat exchangers, boilers and industrial water treatment |
| 9 | Continuous Monitoring Profile | 0.1 µS/cm to 1,000 mS/cm | ±0.5% of span | −10 to 120°C | Automatic, 0 to 100°C | Factory or field calibration | IP65 front panel | Segment display; 4–20 mA, relay and RS-485 | Water-treatment skids and automated process control |
| 10 | Rugged Outdoor Profile | 0.01 µS/cm to 200 mS/cm | ±1.0% of reading | −20 to 80°C | Automatic, selectable reference temperature | 1 to 3 points | IP68 | Sun-readable LCD; Bluetooth data transfer | Field service, irrigation and surface-water surveys |
Applications, Calibration, and Maintenance for Reliable Results
Digital conductivity meters support water treatment, laboratories, aquaculture, and hydroponic production. FAO AQUASTAT estimates that agriculture accounts for about 70% of global freshwater withdrawals. This makes rapid salinity screening valuable in irrigation systems and nutrient tanks. However, conductivity does not identify individual ions. It shows the solution’s ability to carry electrical current, not its complete chemical profile.
Reliable measurements begin with traceable calibration. Use certified conductivity standards that bracket the expected sample range. Rinse the probe with deionized water, then rinse again with the sample. Remove trapped air bubbles before stabilizing the reading. Temperature compensation is essential because conductivity changes with temperature. ISO 7888 and ASTM D1125 provide recognized testing guidance. Small errors matter. Calibration frequency should reflect workload, contamination, and drift, not only a monthly calendar. That routine is often too convenient.
Maintenance requires clean electrodes, intact cables, and careful storage. Inspect the cell after each shift, especially after oily or high-salt samples. Record the standard value, temperature, lot information, operator, and adjustment result. The U.S. EPA lists 500 mg/L as a secondary drinking-water standard for total dissolved solids, but conductivity cannot replace laboratory TDS testing. Conversion factors vary by water chemistry. I would not trust a perfect-looking number without checking trends, uncertainty, and occasional reference samples.