Choosing a conductivity meter digital system in 2026 requires more than comparing screen size or price. It demands evidence.
Recent market analyses from Grand View Research and MarketsandMarkets show continuing demand for conductivity measurement across water treatment, pharmaceuticals, food processing, and environmental laboratories. Their forecasts differ because product categories and regional definitions vary. That difference matters. A buyer should question impressive growth percentages before trusting them.
“Without data, you’re just another person with an opinion,” quality expert W. Edwards Deming observed. His point fits conductivity testing well. A meter may display 1,420 µS/cm, yet that number means little without temperature compensation, calibration records, and a suitable cell constant. Small details decide reliability.
Follow the sample.
ISO 7888 and ASTM D1125 provide useful foundations for conductivity testing. They help users examine calibration procedures, reference materials, temperature control, and reporting practices. In a busy laboratory, a stable probe, readable display, and automatic data logging can prevent costly transcription errors. In field work, battery life and enclosure protection may matter more than advanced software.
Experience also exposes a weakness in many purchasing guides: they treat accuracy as a single number. It is not. Accuracy depends on the sample, electrode condition, temperature, maintenance, and operator technique. This guide compares those practical factors, including range, resolution, connectivity, calibration support, and total ownership cost, so readers can choose a conductivity meter digital solution with greater confidence. Some uncertainty will remain. That is normal. Reliable measurement is managed, not magically achieved.
Choosing a digital conductivity meter in 2026 starts with the sample, not the display. Drinking water, boiler water, soil extracts, and saline process streams need different ranges. The WHO/UNICEF Joint Monitoring Programme reported that 2.2 billion people lacked safely managed drinking water in 2022. That figure makes reliable field testing more than a convenience. It also exposes a common mistake: conductivity does not prove water is safe. It only indicates ionic content.
Write down your expected conductivity range, sample temperature, and testing location. For low-conductivity water, select a sensitive cell and stable shielding. For concentrated brine, confirm the upper range and chemical resistance. Temperature compensation matters because readings can shift noticeably in a cool sample. ISO 7888 and US EPA Method 120.1 provide useful reference points for water conductivity procedures. Use certified calibration standards near your working range, not one solution for every sample. Small details matter.
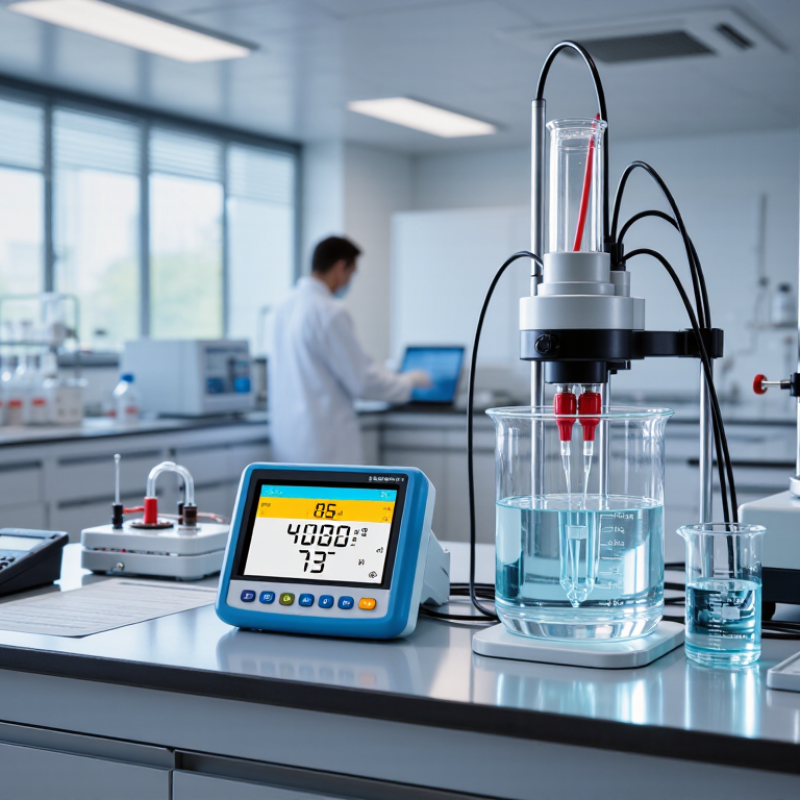
A practical test should include a clean beaker, a rinsed probe, and enough sample to cover the sensor completely. Avoid touching the cell with gloves or metal tools. The WHO Guidelines for Drinking-water Quality associate TDS below 600 mg/L with generally good palatability, but conductivity-to-TDS conversion varies by chemistry. Do not treat the conversion as universal. A perfect-looking number can still be misleading. I would also question meters with impressive accuracy claims but unclear temperature limits, calibration records, or maintenance instructions. Sometimes the overlooked specification is the one that matters most.
| Measurement Need | Typical Conductivity Range | Recommended Cell Constant | Sample Conditions | Important Meter Features | Recommended Resolution | Calibration Guidance |
|---|---|---|---|---|---|---|
| Ultra-pure water monitoring | 0.055–1 µS/cm at 25°C | Approximately 0.01 cm⁻¹ | Very low ionic strength; easily affected by carbon dioxide, contamination, air bubbles, and stagnant flow | High-sensitivity measurement, temperature compensation, low-volume flow cell, stable digital display, fast response | At least 0.001 µS/cm in the low range | Use a low-conductivity verification standard or certified reference procedure; avoid routine calibration with high-conductivity standards |
| Laboratory water and purified water | 1–100 µS/cm at 25°C | Approximately 0.1 cm⁻¹ | Low ionic strength; temperature and exposure to laboratory air can change the result | Automatic range selection, temperature compensation, low-conductivity capability, data logging | 0.1 µS/cm or better | Verify the cell constant with a suitable low-conductivity standard and control sample temperature |
| Drinking water and tap water | 100–1,500 µS/cm at 25°C | Approximately 1.0 cm⁻¹ | Moderate mineral content; suspended particles, bubbles, and unstable temperature may affect readings | Automatic temperature compensation, replaceable probe, stable endpoint indication, waterproof housing | 1 µS/cm or better | A 1,413 µS/cm standard is commonly suitable for routine calibration in this working range |
| Hydroponic nutrient solution | 500–3,000 µS/cm at 25°C | Approximately 1.0 cm⁻¹ | Mixed fertilizer ions; temperature, dilution, algae, and suspended particles can influence the measurement | Automatic temperature compensation, quick stabilization, easy probe cleaning, EC and TDS display options | 10 µS/cm or better | Use a standard near the expected operating range; do not treat estimated TDS as a direct chemical analysis |
| Swimming pool and spa water | 500–8,000 µS/cm at 25°C | Approximately 1.0 cm⁻¹ | Variable disinfectant, salt, and contaminant levels; field temperature and residual chemicals may vary | Portable design, waterproof casing, automatic temperature compensation, replaceable or rugged probe | 10 µS/cm or better | Calibrate before field use and rinse the probe with clean water between samples |
| Saltwater and brackish water | 10–60 mS/cm at 25°C | Approximately 10 cm⁻¹ | High ionic strength; polarization, fouling, salinity variation, and temperature effects are significant | High-range capability, suitable high-range probe, temperature compensation, salinity or practical salinity calculation | 0.01 mS/cm or better | Select a standard close to the expected range and confirm that the probe material is compatible with saline samples |
| Industrial process water | 0.1 µS/cm–100 mS/cm | 0.01, 0.1, 1.0, or 10 cm⁻¹, depending on range | May contain chemicals, suspended solids, scale-forming ions, bubbles, or changing flow conditions | Wide dynamic range, automatic or selectable cell constant, alarm output, data logging, rugged probe, process integration | Better than 0.5% of reading for controlled process work | Use multi-point calibration or verification across the actual operating range; inspect for fouling regularly |
| Acid, alkali, and chemical solutions | 1 mS/cm–1,000 mS/cm | Usually 1.0 or 10 cm⁻¹; high-conductivity applications may require specialized cells | Corrosive or reactive; temperature, concentration, viscosity, and probe material compatibility must be considered | Chemical-resistant probe materials, high-range measurement, temperature compensation, remote or flow-through installation | 0.1 mS/cm or better, subject to process requirements | Use compatible calibration standards and follow the applicable chemical handling and instrument procedures |
| Viscous, oily, or particulate samples | Application-dependent; commonly 10 µS/cm–100 mS/cm | Typically 1.0 cm⁻¹; select based on expected range and fouling risk | Poor mixing, trapped air, coating, and non-uniform composition can cause unstable or biased readings | Open or easy-clean probe geometry, strong temperature sensor, stable endpoint, sample agitation, cleaning access | Usually 10 µS/cm or better; prioritize repeatability over excessive display digits | Calibrate with standards that wet the probe consistently; establish a cleaning and verification schedule |
| Routine field screening | 100 µS/cm–100 mS/cm | Usually 1.0 cm⁻¹ | Variable temperature, limited sample volume, outdoor conditions, and possible cross-contamination | Battery operation, IP-rated enclosure, automatic range selection, large display, calibration reminder, replaceable sensor | 1–10 µS/cm, depending on the screening objective | Perform a pre-use check with a suitable reference standard and rinse the probe between measurements |